It’s not as straightforward a question as you might think
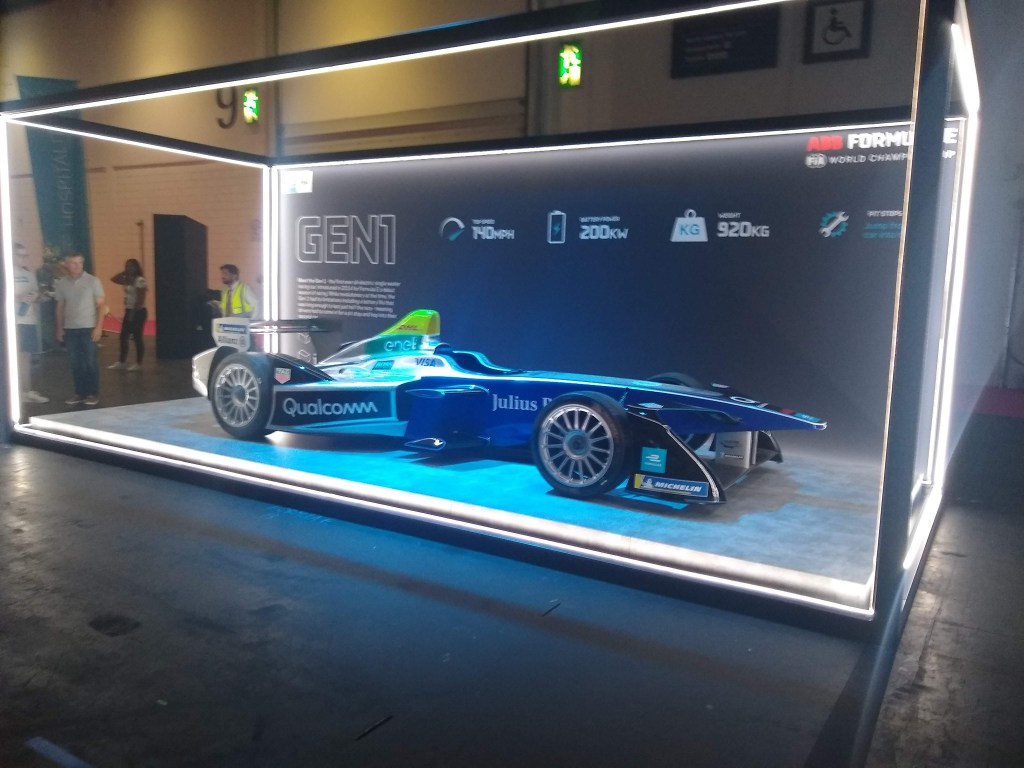
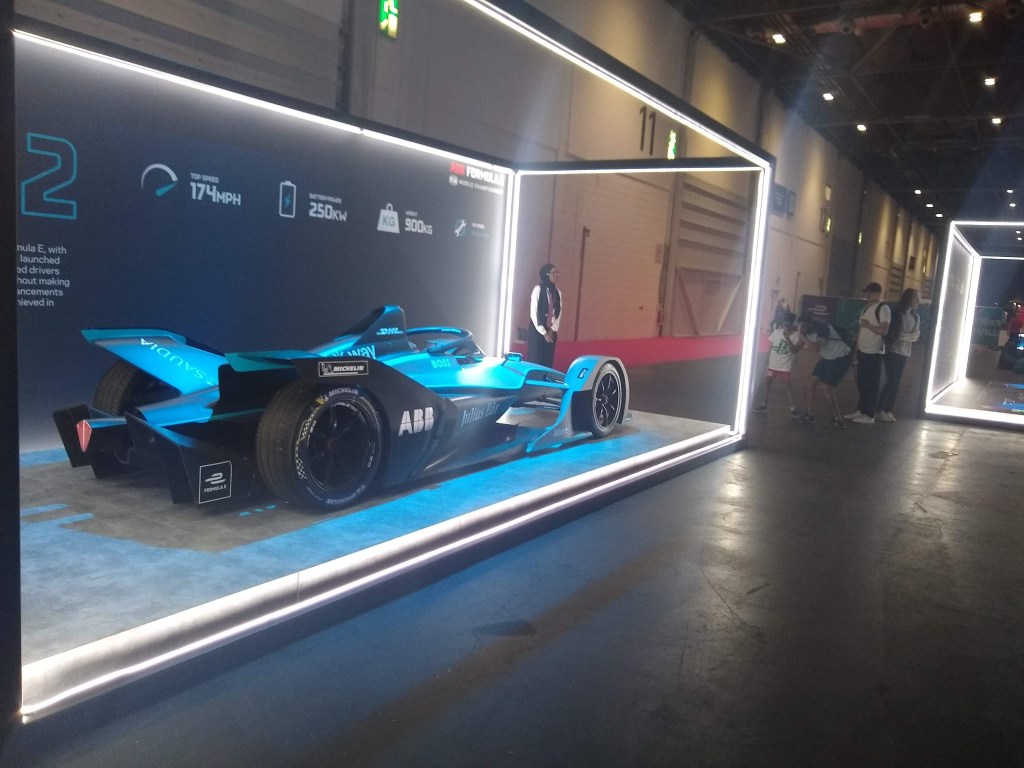

Since the first Formula E races in Autumn 2014, Formula E has run through three generations of chassis and several additional iterations of powertrains (it’s less obvious where one powertrain ends and another begins, since FE’s various different manufacturers have introduced upgrades at different times). The aim – or at least one aim – of these changes was, presumably, to improve performance. And they’ve clearly succeeded at least in part, because if you watch the first ever Formula E race (which you can do easily since Formula E have recently made their entire race archive available online) the cars are clearly much slower than they were in Season 9. But how much faster have they really got?
It turns out not to be the most straightforward question to answer. For starters, what do we mean by “fast”? Probably most people when talking about how fast a car is would refer to its top speed in a straight line. But that’s not the type of speed single-seat race cars are designed for (the story of what BAR had to do to get an F1 car up to 400kph is quite interesting) so it’s not a particularly relevant question. More important is speed around a circuit. Which brings up another question.
What do you mean, “a circuit”?
Formula E hasn’t been great – particularly in its earliest years – at staying in the same places (to be fair, it has this in common with many other race series). Only one of the host locations from season one is still on the calendar – Berlin Templehof – and that one doesn’t use the same track layout. That’s not an uncommon occurrence either – London’s hosted ePrixs in seasons 1, 2, 7, 8 and 9, for example, and only the races in seasons 1 and 2 (in Battersea Park) used the same circuit; all three events at the ExCeL centre have used different track layouts.
All of which means we can’t do the easiest approach to looking at changing performance, of picking an ever-present circuit and looking at how the lap time has gone down. However, while tracks haven’t stayed on the calendar for all nine seasons, there has been some season-to-season continuity. For example, in season 2, Miami, Monaco, and Moscow left the calendar, and the Berlin race moved from Templehof to a street circuit (which I’ve represented as Templehof leaving the calendar and the street circuit being added). Mexico City and Paris arrived on the calendar, and the layout of the Beijing and Punta del Este tracks were changed. Battersea Park, Buenos Aires, Putrajaya and Long Beach were unchanged and can be used for comparisons. The graph below shows how events have fallen into those categories over the years:
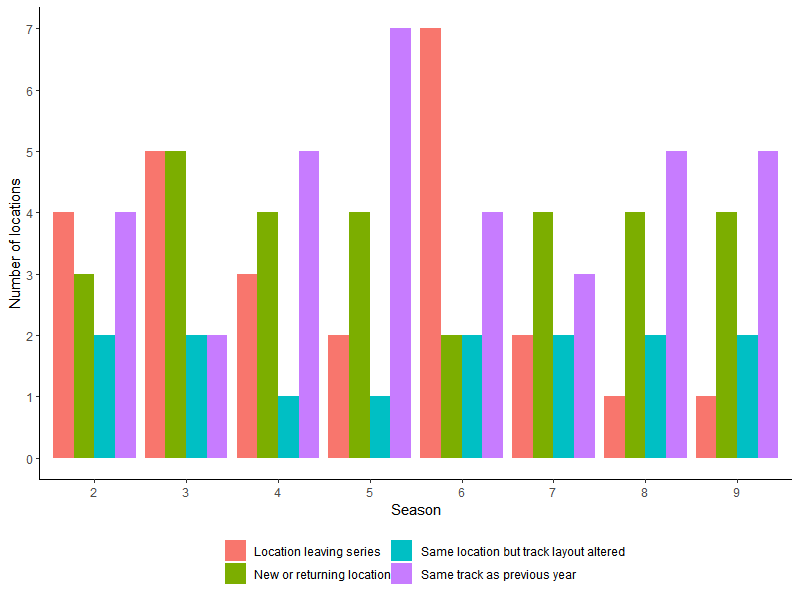
So this means we’ve got two options – we can do year-on-year comparisons relying on the tracks that weren’t changed, or we can look at overall average speed across years. Both have problems – in the case of year-on-year comparisons, sometimes we have a very small sample size and we may be unrealistically generalising from a small number of circuits, and by comparing overall averages we may not be making a like-for-like comparison (this is particularly the case in season 9, where several of the new circuits were intended to let the more powerful Gen3 car “stretch its legs”). However, if both approaches tell more or less the same story then we can have a lot more confidence in it.
Hang on, back up a bit…
We’ve established we were interested in “speed around a circuit” earlier (and that the “circuit” part of that is potentially problematic, but that we’ve got a plan), but the “speed” bit’s still a bit nebulous. Usually when talking about a driver’s “speed” motorsport fans are thinking about the outright pace a driver shows in qualifying. On the other hand, when we think about the development of battery electric vehicles the total amount of energy they can put out is more interesting. Since Formula E cars aim to expend the entire battery over the course of a race, the total energy output is represented by the average speed they manage (Formula E has had both fixed distance and fixed duration races, but if we look at speed it doesn’t matter – either they used more energy to do a fixed number of laps faster or to go further in 45 minutes). So that means overall we’re interested in two different “speeds”:
- average speed of the fastest qualifying lap (which may not actually have been the pole lap due to having been in group qualifying rather than SuperPole or the duels)
- average speed of the winning driver in the race
and we’re going to compare across years in two different ways:
- Races at the same (unaltered) tracks in successive years
- The overall year-on-year season averages.
Change in Season Average Speeds
I’m starting with this because it’s the easiest one to understand. Looking first at the absolute pace of the cars in qualifying, we see the overall increase in speed across the years you might expect, but with some odd dips:
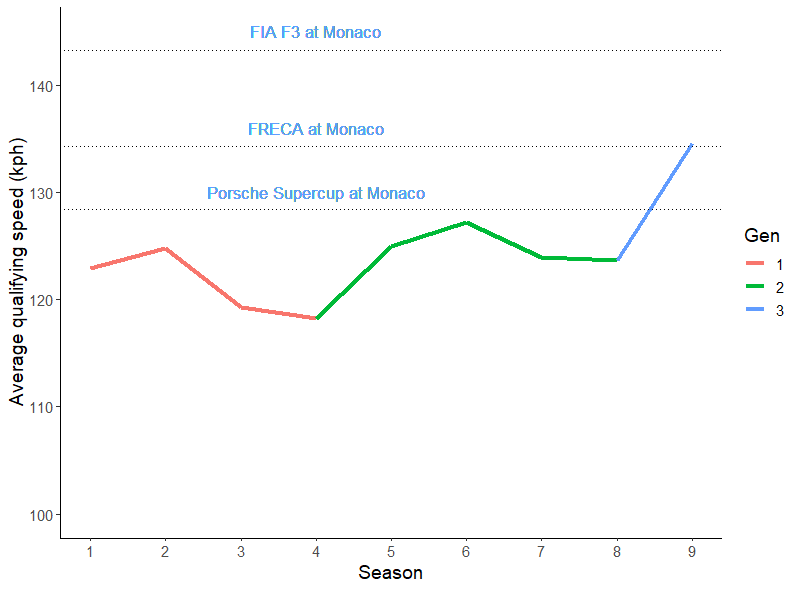
What’s up with those? Well, it’s the problem with circuit changes we were worried about earlier. In Season 3 the Hong Kong ePrix was added to the calendar. The circuit was extremely tight and twisty and, well, slow. Simultaneously, the Long Beach track which had been the fastest in Seasons 1 and 2 was removed. In S4 Hong Kong was expanded to a double-header which is unlikely to have helped…
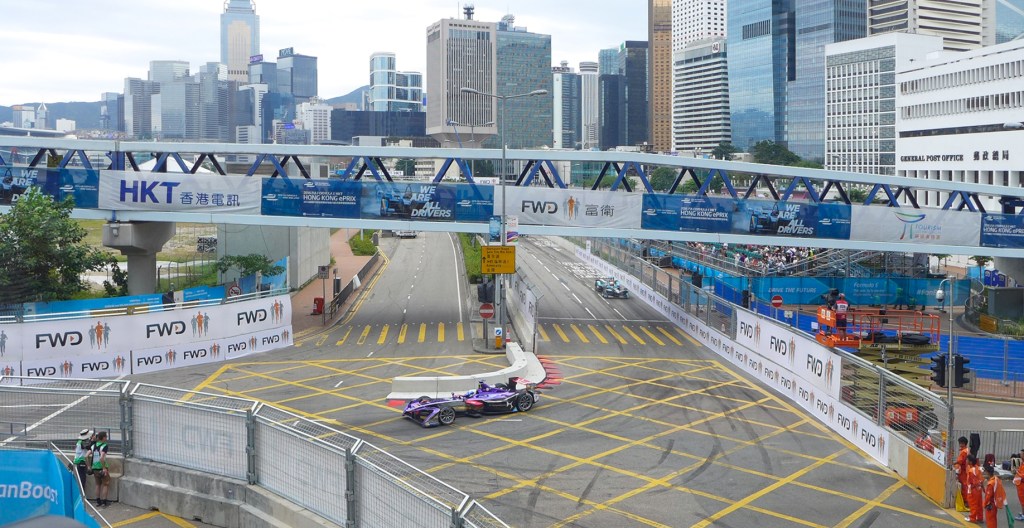
Season 7 is a similar case – in this case the slowpoke circuit was the twisty indoor/outdoor London ExCeL track (which is so slow the cars actually aren’t allowed to use the entire battery in the race).
Looking at races it’s a fairly similar story, except Formula E is relatively slower on race pace than it is on qualifying pace compared to other sprint series (which is not surprising since FE race lengths have always been set to require energy saving – FE is really an endurance series in disguise). Here I’ve excluded races where the total race time was inflated by a red flag (the clock keeps running during a stoppage) but safety cars are still in here (they’re common to all race series after all). That’s actually partially responsible for the season 7 dip – some of it’s just London being very slow but there was also a very long safety car period in the second London ePrix of season 7 (which is mostly famous for Lucas di Grassi attempting to overtake the entire field via the pitlane, but that’s another story).

So the overall answer, looking at season average speeds, is that from season 1 to season 9 we’ve seen about a 10% improvement in performance (exactly 10% in qualifying terms, closer to 12% in races) and, based on the performance jumps in the second season of Gen1 (season 1 to 2) and Gen2 (5 to 6), we’d probably expect the Gen3 cars to be another couple of percentage points faster this year than they were last year – around 137 kph average in qualifying and 120 kph in races.
Performance Index based on events on the same track
Since we’ve found that the changing nature of the calendar does have an impact on the average speed, it’s probably a good idea to look at the tracks that didn’t change from season to season. As mentioned before, for season 2 that was Battersea Park (which was a double-header), Buenos Aires, Putrajaya and Long Beach. In qualifying, the pole times for season 2 were about 1.3 % faster; the race times were on average about 3.2% faster (though this ranged from 8% faster to the second Battersea race actually being slower – the point of averaging is to smooth these sort of variations out).
The calendar didn’t get any more stable for season 3 – the Beijing, London (Battersea Park), Putrajaya, Long Beach and Punta del Este rounds all left the calendar. Berlin Templehof returned, but with a different track layout. The only tracks that had been used in the same configuration were Buenos Aires (in season 1 and 2), Monaco (in season 1), and Paris (in season 2). Buenos Aires and Monaco we can directly compare to season 1; to compare Paris to season 1 we have to compare to season 2 (the S3 pole lap was actually 1% slower) and then adjust by how much season 2 qualifying was faster than season 1 (the 1.3% from the previous paragraph), which in the case of Paris suggests that if it had been raced in season 1 the season 3 pole lap would have been only very slightly faster (about 0.2%). We can go on like this for each season, comparing lap times to the first time that track shows up on the calendar, and then adjusting that based on the (already calculated) difference between that season and season 1.
…and if you do that, what you get is a nonsense. It turns out that since we’ve decreased the sample size by only comparing events held on the same track, the numbers are now much more vulnerable to one-off events such as wet qualifying sessions, the fact that the second race of an event is usually faster as the track is rubbered in, and Diriyah moving from daytime to nighttime in 2021. But once you account for all of those factors, it turns out that qualifying speeds haven’t really changed much since the start of Gen2, it’s just that the circuits have got faster:
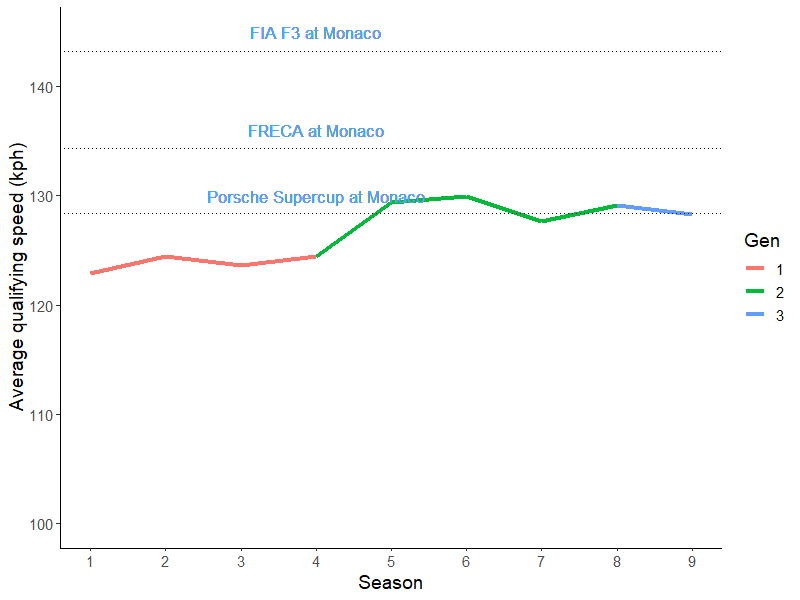
This does make sense – neither then Gen1 nor Gen2 cars ever gained power, so the only qualifying speed gain in seasons 1-8 should come with the arrival of Gen2, and while the Gen3 car is significantly more powerful than the Gen2, it also has much less grip due to the change to harder rubber. What about races, though, where improvements in energy management techniques might bring about overall speed increases? Well, something weird happens:

In Gen1 we do indeed see continuing average speed improvements as teams get better at energy management – partially race strategy, partially improved regen systems and control software. Then something goes very wrong in Gen2, until it suddenly rebounds in season 8. My guess is this is graphical evidence of FE’s bumper cars era. Gen2 was full of safety cars (the only reason Season 5 isn’t slow as well is because the crashes in the first season of Gen2 were even bigger and instead of a forest of safety cars we instead had red flags in five races) which obviously slow a race down.
What happened to fix it in season 8? The qualifying rule change. Group qualifying gave an advantage to drivers further behind in the championship, because they’d go out in later qualifying groups. This meant that FE’s grids were biased towards reverse championship order, with quicker cars towards the back. This became increasingly the case as the gaps between cars diminished over seasons 6 and 7 until the championship lottery that was S7. It also meant that in any given race a greater number of fast drivers were trying to come through from the back and therefore quite likely making risky overtaking moves. Duels qualifying, on the other hand, does generally put the fastest cars towards the front, meaning that there’s less incentive for the sort of mad lunges that kept the safety car in business. Gen 3 finally being quicker over a full race distance than Gen 2 is no surprise either – we saw that they were about the same speed in qualifying, but the Gen 3 car has superior regen capacity, so it’s no surprise it’s faster over a race distance.
Wrapping it Up
So, how much faster have Formula E cars got over its first nine years? In races, my two methods actually roughly agree with each other that the answer is roughly 12%, or from an average speed of around 105 kph to around 118 kph (which is not quite as slow as it might sound given the nature of the tracks they race on, but still slower than, say, a Formula Regional car). In terms of their outright qualifying pace, though, about half the improvement in average speed has come from replacing slower circuits with faster ones, so while they’re going about 10% faster only some of this comes from the machinery. Still, the qualifying pace is relatively more impressive – not quite at the level of an F3 car but faster than a Formula Regional one over a single lap (indeed, the last time FRECA raced at Monaco the pole time was 1:29.459, a time which would have got you knocked out in the quarter-finals of the duels at the last Monaco ePrix).
They should continue to get faster from here as well, though as before it should mostly come in terms of race pace until mechanical changes arrive to the cars with the introduction of the Gen3 Evo in 2025.

Leave a comment