Sector analysis gives a few hints – at least before the BoP change
The 24 Hours of Le Mans isn’t quite like any other race – even Daytona – and the Circuit de la Sarthe isn’t quite like any other racetrack. Still, there are some similarities with other tracks, and one of them is Spa-Francorchamps. While Spa’s second sector, shown here in red, is a somewhat twisty section that rewards higher downforce levels, the rest of the circuit is a mostly full-throttle blast except for the odd chicane and hairpin.

This combination bears more than a passing resemblance to the majority of the Circuit de la Sarthe:
This rather obviously raises the question as to which cars did best in sectors one and three – the hairpin at La Source, the sweepers at Eau Rouge-Raidillon, the full-speed blasts along the Kemmel Straight and from Stavelot through to the Bus Stop, which are the most similar bits of the track to those we’ll see in June. Additionally, it was a warm day at Spa and the race went on longer than it should into the evening due to a long red flag, so we’ve got some facsimile of the potential temperature range (probably not the whole thing). So let’s take a look.
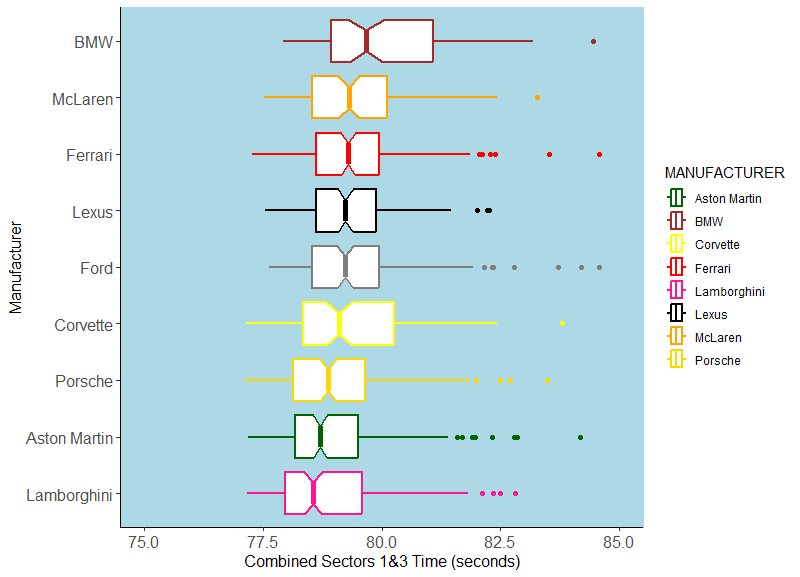
Hypercar
Sector Times
I’ve taken the data from all six hours of the race and combined the sector one and three times, removed any non-green flag laps or laps where the car was in the pits, and put the rest on the box plot below. (This is a “notched” boxplot, which attempts to visualise statistical significance – if the notches don’t overlap then the difference is significant. You’ll see the notches are wider for Cadillac and Lamborghini, which is because the single-car efforts have half as many laps and therefore a wider margin of error.
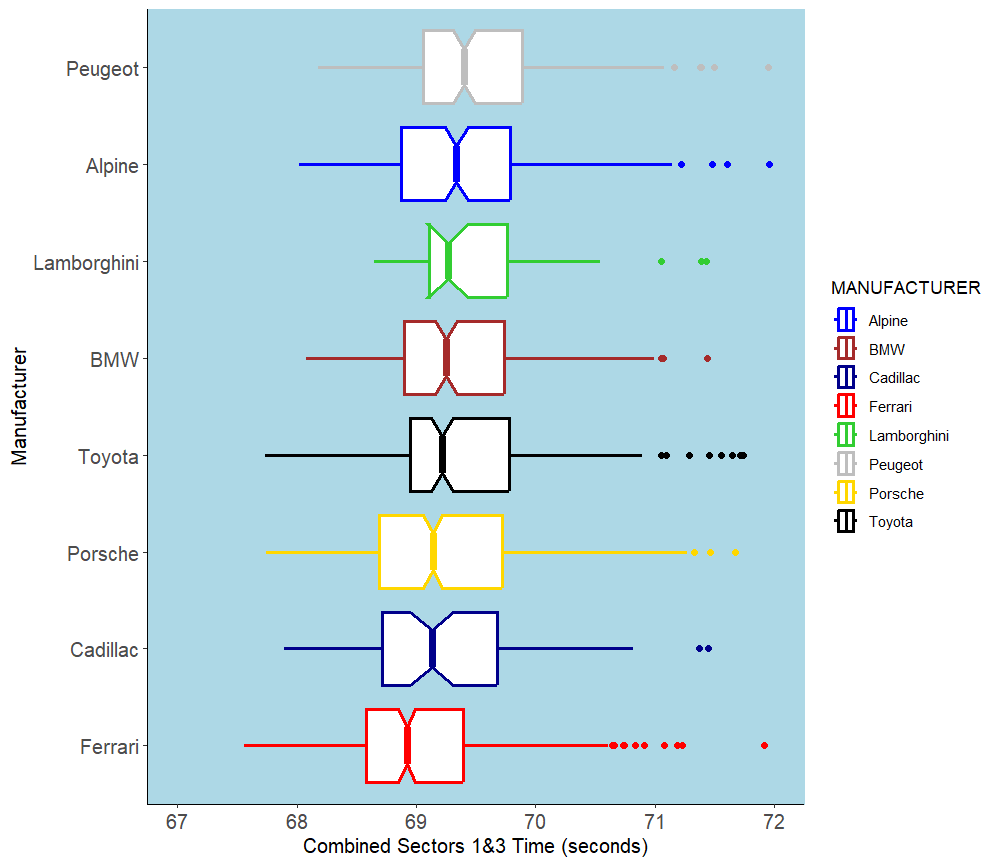
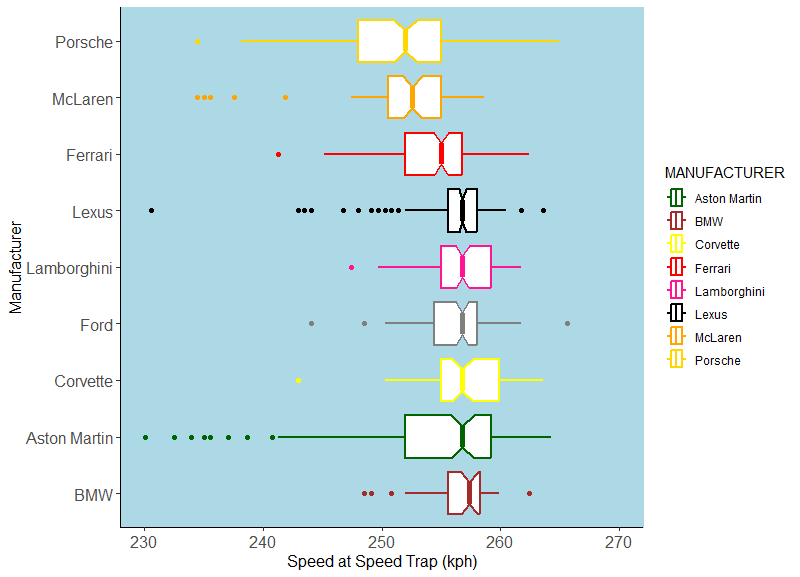
The Hypercars are broadly lined up in the order you’d expect from watching the race (I’ve left Isotta Fraschini out because a) their laptimes are very erratic and screw with the stats and b) while definitely not in Vanwall territory, they’re also quite significantly slower than everyone else), with Ferrari in particular at a significant advantage. That was probably down to their straight-line speed – if we look at the car’s speed at the speed trap on each lap, Ferrari and Alpine had a clear advantage (Porsche, on the other hand, must have been faster through the slow corners). This ought to be familiar to anyone who watched Le Mans last year, too, as the Ferraris had a clear straight-line speed advantage then.
Straight-line Speed
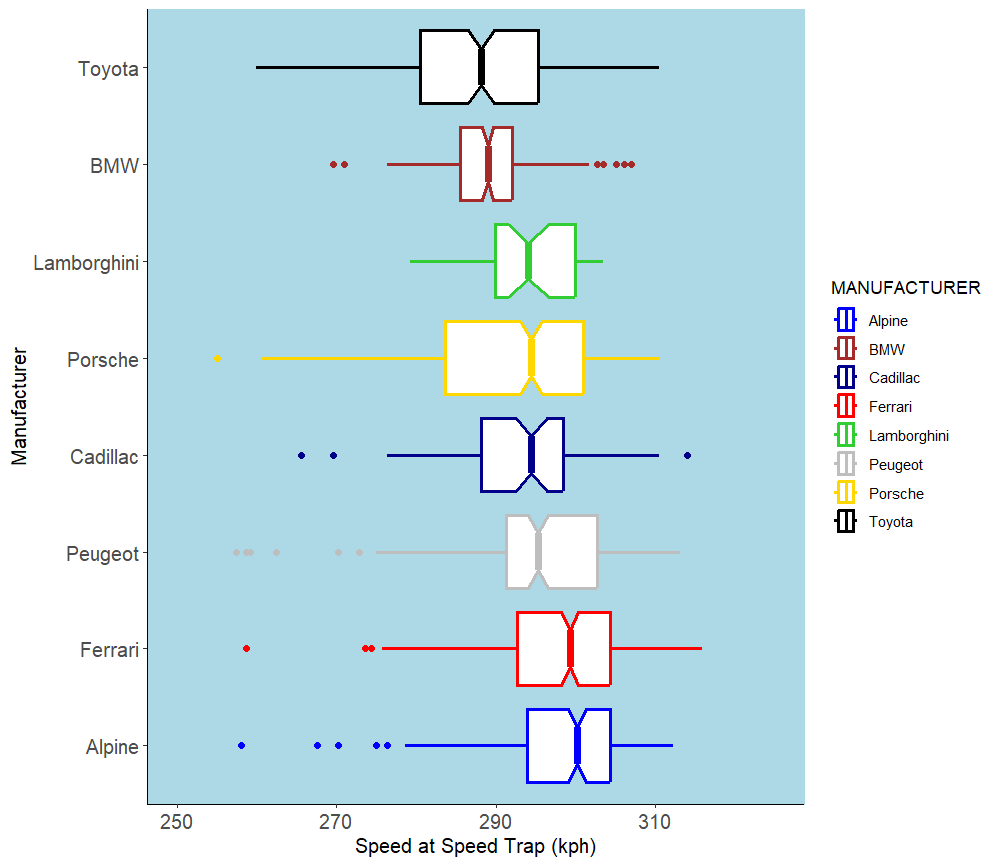
Watching the race it seemed to me that the Toyotas were struggling to overtake and looking at the straight-line speed distribution it’s not surprising why. The Toyota clearly has fairly decent downforce which helps it to look after its tyres (and the car was also relatively quick through Sector 2 here, though slower than Porsche and, again, Alpine – a car that must really struggle in slow corners given their performance here), but it’s not a car particularly well-designed for Le Mans (something that’s been a regular feature of Toyotas throughout their time in WEC, in fact). It’s probably reasonable to say that TGR’s 6th/7th finish at Spa was not only about as good as they might reasonably have expected but probably about what we should expect at Le Mans too.
Temperature
That said, there’s another feature of Le Mans to consider and that’s how the cars cope as the temperature changes as we go from day to night. There wasn’t a huge range of temperature variation at Spa but the track temperature did go from a high of 38°C to a low of 28°C (for comparison, at Le Mans last year it ranged from 22-48°C), so we can perhaps get some idea by looking at how each car’s laptime varied as the temperature changed. Obviously, due to other factors like traffic and tyre strategy, this is going to be really imprecise, but it’s possible we’ll learn some things. The trendlines here are plotted using R’s linear model function, with the grey areas showing the confidence intervals:
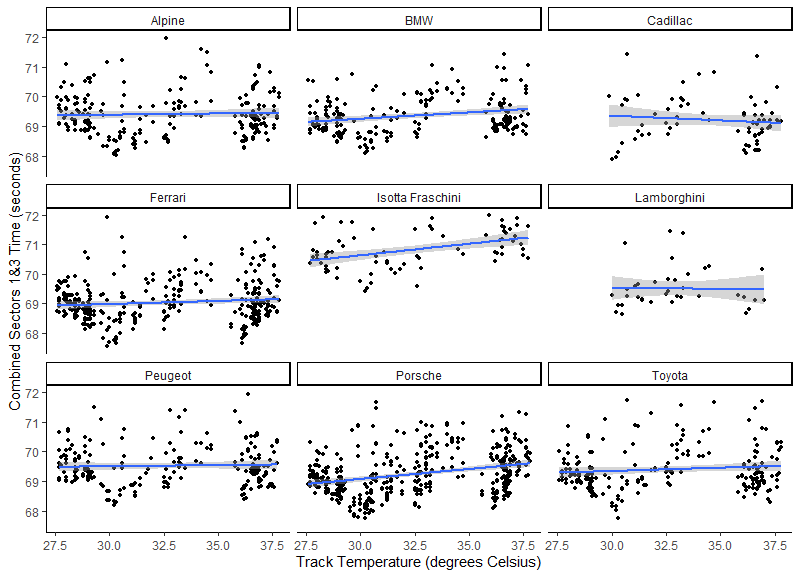
For Cadillac and Lamborghini, whose solitary cars didn’t survive to race in the cooler section after the red flag, we can’t tell much; maybe the Caddy slightly prefers warmer temps but there’s not much in it, and that’s likely biased by them starting the race (when it was cooler) on the tyres they’d qualified on. The Alpine and Peugeot don’t seem to care much, or else their strategies negated the effect of the temperature change. Maybe it’s just being French. The Porsche and the Isotta seem to strongly prefer cooler temperatures – a trend strong enough that it’s likely real – while the BMW, Ferrari and Toyota are more temperature-agnostic but might have a slight preference for the cooler parts of the day, or that might have been caused by some other factor. Does this mean much? Well, I guess we might say that if Porsche are leading at sunrise then Ferrari might well come back at them; if Ferrari are leading it’s probably over. If Toyota are leading I’d expect a GT3 car to take them out anyway based on last year….
But What About BoP?
Well I don’t know, obviously. It’s likely that the ACO will make some circuit-specific changes even if they don’t do anything else, since they have before every other race this year. Personally, based on this analysis I might cut the Ferrari’s power a little and give the Porsche a bit more weight, as that should even out their main areas of advantage. I’d be tempted to give the Toyota a bit more power and a bit more weight, perhaps. This is another way of saying that Porsche have an edge in slow corners and Ferrari (and, apparently, Alpine) have better straightline speed, both of which should be important advantages at Le Mans. Overall though we’re definitely seeing the Hypercar field beginning to come together, even if right now the Porsches and Ferraris do have a distinct advantage it’s not an unassailable one (as Toyota showed by heisting a win at Imola).
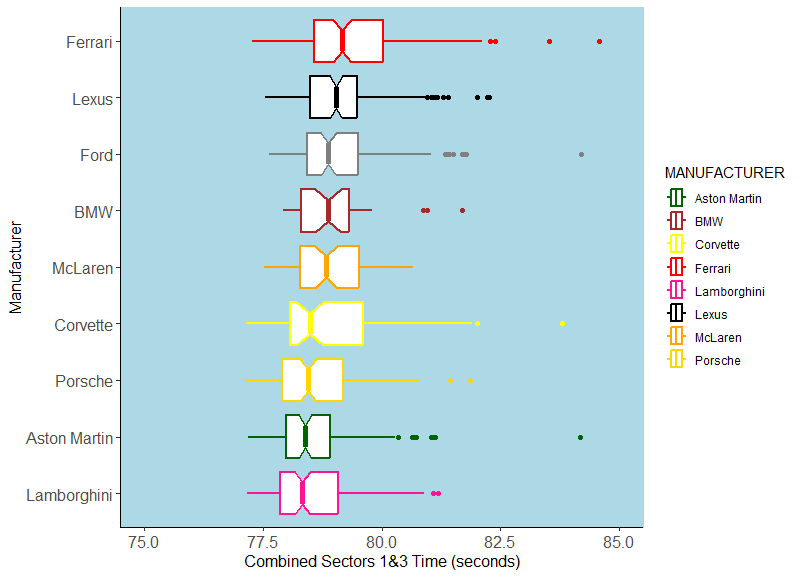
LMGT3
Sector Times
Using the same methods as for the Hypercars above, we get this boxplot of combined sector one and three times:
However, I feel like there’s something of an issue here, and it’s that when we’re looking at GT3 there’s the influence of the Bronze drivers to consider; in particular the Lamborghini and Porsche have a “Bronze” driver each in Sarah Bovy and Alex Malykhin who hardly count as such, which might be skewing things slightly (then again, Lamborghini also have Claudio Schiavoni, who was doing his best to lose an entire lap to Sarah Bovy in the early part of the 6 Hours). So let’s bin off the Bronzes and try this again. It does make a bit of a difference, particularly trimming the tail off of the BMW distribution, but overall the same cars are at the top, though there’s not much in it. While it may have seemed watching that the Lamborghini’s edge over the Aston Martin (and to a lesser extent the Porsche) was bigger than this, much of that came in Sector 2, the higher-downforce section of the track (where the McLaren was actually the second-fastest car). That won’t be so helpful at Le Mans, where it looks like the Lambo will be roughly evenly matched with the Aston and the Porsche, at least.
Top Speeds
In terms of top speeds (and once again I’ve removed the Bronzes, though they don’t make that much difference this time) the data suggests the Porsches were all over the place but may have been a little underpowered, McLaren, if they weren’t at minimum wing angle, may have gone with too much downforce (given their overperformance in sector 2), Ferrari were slightly down and everyone else is much of a muchness, so the top three above must find what edge they have in cornering performance.
Temperature won’t work this time
In theory I should also take a look at temperature here, but this time the data will just be completely confounded by the driver classification – most teams started with the Bronze, moved to the Silver and finished with the Pro driver, which means they all did their fastest laptimes in the coldest part of the day…because that’s when the Pro was in the car. Not much to be learned there alas.
GT3 BoP?
I’d say it’s closing on a pretty good place! Lamborghini were probably too strong (and could easily have had a 1-2 but for a mix of bad luck and bad strategy) at Spa, but that was mostly a pretty track-specific thing whereby Spa’s high-downforce sector 2 gave a car designed for high speeds an edge. That’s probably not going to be much of an issue again until maybe Bahrain. Might be worth giving Lexus and Ferrari a small break on the evidence of Spa; possibly BMW as well who may have been over-nerfed after Imola.

Leave a comment