Just because they don’t publish it doesn’t mean we can’t talk about it…
The ACO no longer publish the WEC Balance of Performance (hereafter BoP), arguing that because the homologation parameters of the cars aren’t public, it’s not possible for the general public to understand it. This is a bit of a ludicrous thing to say, as almost all analysis is done on the basis of incomplete information. Most people think it was just an attempt to stop people talking about it, and I’m here to show them that won’t work either.
The BoP has two main components – one derived from the homologation parameters of the cars as measured in the Windshear wind tunnel, and one based on performance. Part 1 allows ACO to calculate circuit-specific parameters that in theory should be able equalise performance, but as they accept the simulation isn’t perfect they also adjust based on past performance. The metric used is supposedly based on the top 60% of laps, taking the best 2 out of the last 3 races.
In practice, having looked at how the lap time distributions worked, I think they meant the best two out of the last three dry races, since Lone Star Le Mans does very strange things to any performance index you might calculate if you leave it in. We don’t know the precise method that the ACO use, but they’d want something that’s circuit independent. That essentially means it needs to take into account both what a “normal” lap time around the circuit is and also how that changes over time – otherwise Bahrain, for example, which is notoriously rough on tyres, will be almost everybody’s worst race of the three for all the time it’s in range.
I used a variation on what statisticians often call z-score:
where μlaptime is the average lap time and σlaptime is the standard deviation of the laptime. Importantly, you have to cut to the best 60% of laptimes first and then calculate the z-score, otherwise you’re just measuring how much faster the best 60% of laps are than all of the laps – which is really just a measure of tyre degradation and everyone’s best race is suddenly Bahrain (which is notoriously tough on tyres). This would definitely be news to anybody who actually watched the 8 Hours, which was a Toyota walkover. As to why I’ve subtracted it from 1 rather than taking the normal value, that’s because a) I want better performance to be a higher number, and better performance means lower laptimes, and b) adding one to the result prevents any of the performance indices being negative.
As a result of that, a score of 1 is perfectly average, a score above 2 is dominant (such as Cadillac at Interlagos, a 1-2 with only one other car on the lead lap) and a score below 0 sucks (such as Toyota at Interlagos, with both cars 3 laps down)
Before Imola
Taking the average value of 1 minus the z-score for best 60% of each team’s laps for the three races before Imola, we get this. I’ve bolded the best two performances to make it easier to tell which ones go in to the performance index:
| Manufacturer | Car | Sao Paulo | Fuji | Bahrain | Best 2 Average |
|---|---|---|---|---|---|
| Alpine | A424 | 0.98 | 1.47 | 1.04 | 1.25 |
| Aston Martin | Valkyrie | 0.31 | 1.27 | 1.20 | 1.23 |
| BMW | M Hybrid V8 | 0.96 | 0.46 | 0.60 | 0.78 |
| Cadillac | V-Series.R | 2.34 | 1.57 | 0.65 | 1.95 |
| Ferrari | 499P | 0.75 | 0.49 | 1.14 | 0.95 |
| Peugeot | 9X8 2024 | 1.11 | 1.43 | 1.09 | 1.27 |
| Porsche | 963 | 1.54 | 1.00 | 0.60 | 1.07 |
| Toyota | GR 010 Hybrid | -0.14 | 0.47 | 1.77 | 1.12 |
| Genesis | GMR-001 | 2.34 | 1.57 | 1.77 | 2.06 |
For Genesis, as for any other newcomer, the rule is that they get a performance-related BoP equivalent to the best performance of any other team. It’s not entirely clear to me if that’s the best performance of any other team on a per track basis or overall; I’ve done it per track here.
So before the 6 Hours of Imola, I suspect Cadillac may well have had the worst performance-related BoP (though overall, Ferrari and Toyota would probably still have had more weight/less power, since their LMH cars do naturally sit a bit higher in the allowed performance envelope than you can get with an LMDh). Ferrari (whose best result here was a third at Bahrain) would probably have been at a low point in their BoP trajectory. Toyota on the other hand had a friendly BoP at Bahrain (and you can see why), but after they stomped the field in that race it was getting worse again. So what happened next?
After Imola
Toyota won from Ferrari, as you probably know, but they did it on strategy and fuel saving, and a slim majority of the fastest laps actually belonged to the Maranello squad:
| Manufacturer | Car | Fuji | Bahrain | Imola | Best 2 Average |
|---|---|---|---|---|---|
| Alpine | A424 | 1.47 | 1.04 | 1.06 | 1.27 |
| Aston Martin | Valkyrie | 1.27 | 1.20 | 0.64 | 1.23 |
| BMW | M Hybrid V8 | 0.46 | 0.60 | 1.12 | 0.86 |
| Cadillac | V-Series.R | 1.57 | 0.65 | 1.35 | 1.46 |
| Ferrari | 499P | 0.49 | 1.14 | 1.64 | 1.39 |
| Peugeot | 9X8 2024 | 1.43 | 1.09 | 0.14 | 1.26 |
| (Porsche) | (963) | (1.00) | (0.60) | (1.64) | (1.32) |
| Toyota | TR 010 Hybrid | 0.47 | 1.77 | 1.60 | 1.69 |
| Genesis | GMR-001 | 1.57 | 1.77 | 0.06 | 1.67 |
Toyota and Ferrari’s strong performances (it really was a two horse race) give their performance indices a big increase, which would also affect Porsche if they somehow showed up to Spa as they’d get Ferrari’s score. Cadillac mostly benefit from Interlagos not being in the calculation any more, and Genesis likewise. For everyone else, Imola didn’t change things much. To visualise the changes:
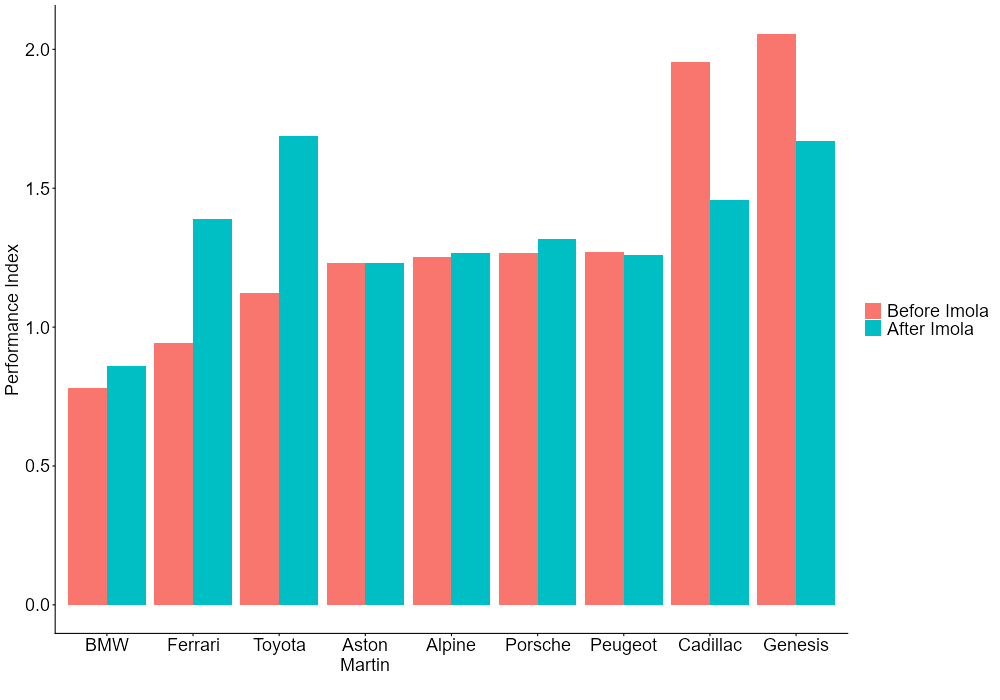
Writing this as I am after Ferrari and Toyota both had fairly hideous qualifying performances (unless your name was Antonio Fuoco), I feel this might shine some light on at least one of the reasons.

Leave a comment